Graphs in Javascript
Weather data
To get some test data, I am using the wonderful OpenWeatherMap service. To use this service, you need to obtain an API key, then browse to the following address:
http://api.openweathermap.org/data/2.5/forecast?q=Melbourne,AU&units=metric&appid=YOUR_API_KEY
The result is something like the following(JSON format):
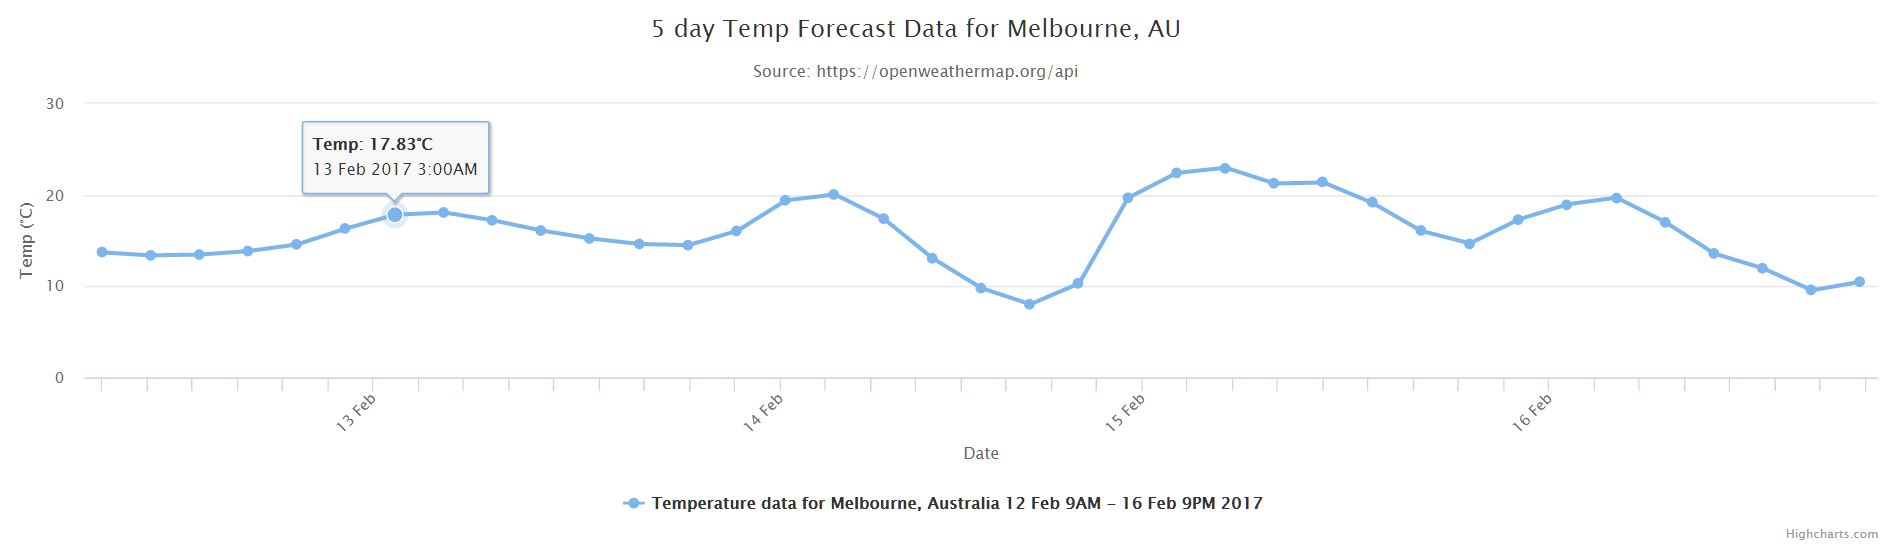
Only interested in showing temperature data.
Highcharts
highcharts.html
Rob’s charts in Highcharts (uses ngrok to view):

extract-plot-data.js
Result


Leave a Comment